How to use the DRYIT semi-continuous tray dryer
Practical Action
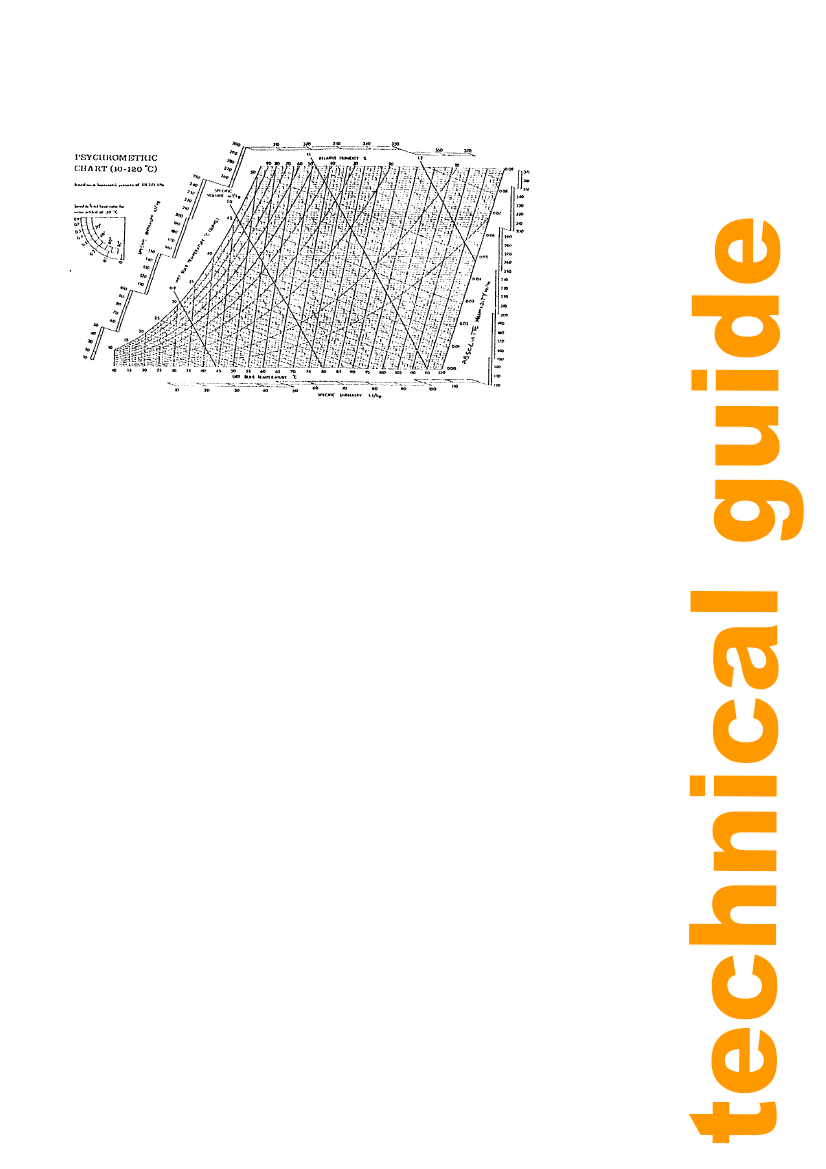
Figure 6: Graph to show temperature of bulb against humidity
The psychrometric chart explained
Dry bulb temperature
One axis gives the dry bulb temperature. This is the temperature of air using a standard
thermometer.
Absolute humidity of air
The other axis gives the absolute humidity of air which is the weight (kg) of water vapour in
1kg of dry air.
Percentage saturation lines
The percentage saturation lines relate to the absolute humidity of the air as a percentage of
the absolute humidity of air that is fully saturated (when the air can hold no more water
vapour). This is very similar to relative humidity and hence relative humidity values are more
commonly used. For example air in a tropical basin region of the world, such as the Amazon,
at 85% relative humidity (RH) is relatively more humid than air in a tropical mountainous
region, such as the Andes, at 25% RH.
Adiabatic cooling lines
The adiabatic cooling lines show what happens to the temperature and humidity of air when it
is used for drying. The heat in the air will be used to evaporate the water. This will cause the
air to cool down which in turn will cause it to lose capacity to pick up water vapour. ie the air
effectively becomes more humid. On the psychromatic chart the adiabatic cooling lines go
'up' the absolute humidity axis as one goes 'down' the dry bulb temperature axis from right to
left.
Wet bulb temperature
A wet bulb thermometer is a standard thermometer with the mercury bulb enclosed in a
18